The Misconceptions of San Diego Wildfires
Despite what many say, "fuel load" is not a factor in wildfires
The misconception of wildfire, chaparral, and “fuel load”
For the last hundred years, fire elimination and suppression have been the means of controlling fires in the United States. This strategy, ironically, leads to the buildup of fuels in the Southwestern forests, with the result being larger, and more destructive forest fires.
Scientists have proposed that this paradigm applies to the conditions of chaparral in San Diego County, that the county’s wildfires are the unnatural result of fire suppression.1 The press has echoed this idea. Just months after devastating fires whipped through San Diego in 2003, the Union Tribune, the local newspaper, had this to say, “City fire officials told the newspaper that urban canyons pose the greatest threat due to the heavy fuel load in unburned areas and in areas that did burn and are seeing a surge in new growth.”2
This thinking goes beyond San Diego to fire management of chaparral throughout the state. In 2012, in an article about wildfire, the Ventura County Star quoted Scott Holder, a hydrologist for the Ventura County Watershed Protection District, as saying, "The fire-prone areas are the areas with a larger fuel load that have not burned. Areas like the Camarillo Springs Fire haven't burned in 20 years since the Greenmeadow Fire in '93."3 Managing large fuel loads has become part of fire management for the state of California, with prescribed burns being suggested for managing chaparral.4
Fire: a natural component of chaparral and coastal sage
For southern California, wildfire has been part of its ecosystems for millennia. Rain and snow usually come to southern California in winter and spring, usually from November through March, often into April. Six months of drought follow.5
Starting in October of most years, the Santa Ana winds come in from the deserts to the east. The winds can reach speeds of 40 or 50 miles an hour or more. They are warm, raising the temperatures into the 80s, 90s, and sometimes into the triple digits Fahrenheit; the winds are also bone dry, with humidity plummeting sometimes into the single digits.6 Under such conditions, the slightest spark can turn hillsides, open fields, even houses into raging fires within minutes.
Other scientists counter that the Santa Ana winds, more than anything else, create the conditions for the conflagrations. In a study, they compared the incidence of fires in San Diego County after 1950, when fire suppression was at its greatest, with patterns of burning before 1950. The researchers found no significant difference in burning, saying, “Under these conditions [Santa Ana winds], fires readily burn through all age classes of fuels and thus, rotational burning programs that attempt to modify vast stretches of chaparral landscape through age class modification are not likely to be effective in stopping these catastrophic fires.”7
An historic opportunity to test the hypothesis
In October of 2003 and October of 2007 wildfires raged through San Diego County. In both years Santa Ana winds spread the conflagrations. Only four years passed between the two events, offering little time for shrubs and trees to regrow and the buildup of fuels. If the theory that fire suppression leads to greater fires is true, then the wildfires of 2007 should be excluded from the areas burned in 2007.
In 2003, three major fires scorched San Diego: The Paradise Fire, Cedar Fire, and Otay Fire.
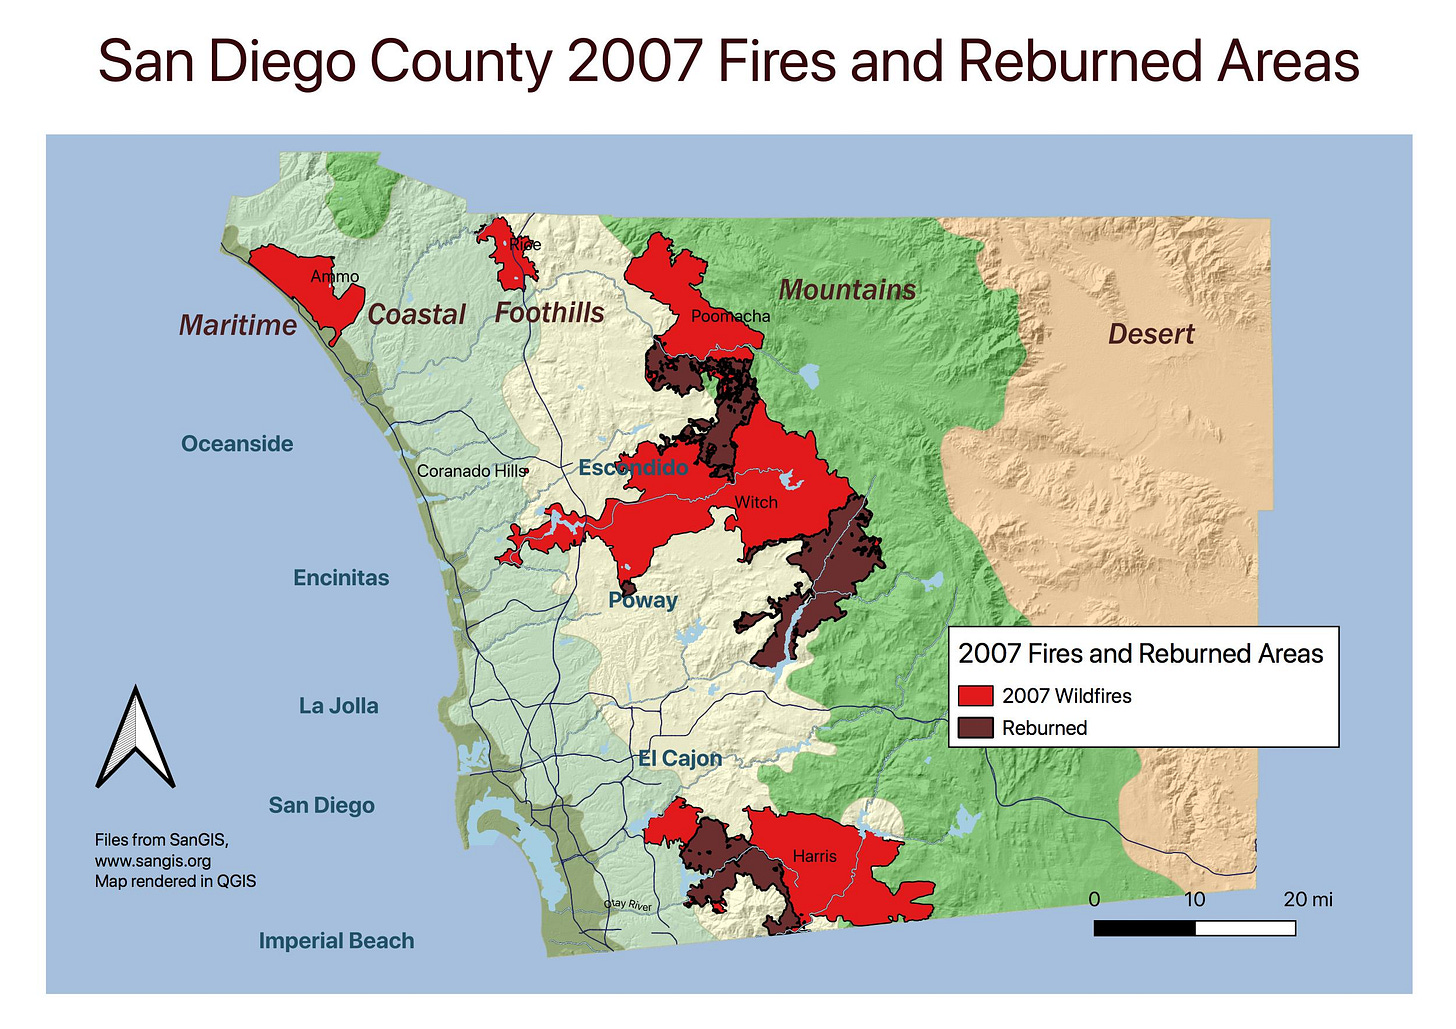
In 2007 a number of wildfires swept across the County, reburning much of the areas that had burned in 2003.
Fire Acres Burned Acres Reburned % Reburned
Paradise 56,427.77 29,029.97 51.4%
Cedar 280,265.66 40,375.50 14.4%
Otay 44,698.75 25,795.30 57.7%
Total 381,392.18 95,200.77 24.96%
Table 1.
Of the 2003 wildfires, almost 25 percent was reburned in 2007. On the face of it, this would seem weak confirmation that it is the hot, dry Santa Ana winds that make the extreme wildfires.
But let’s take a more in-depth look.
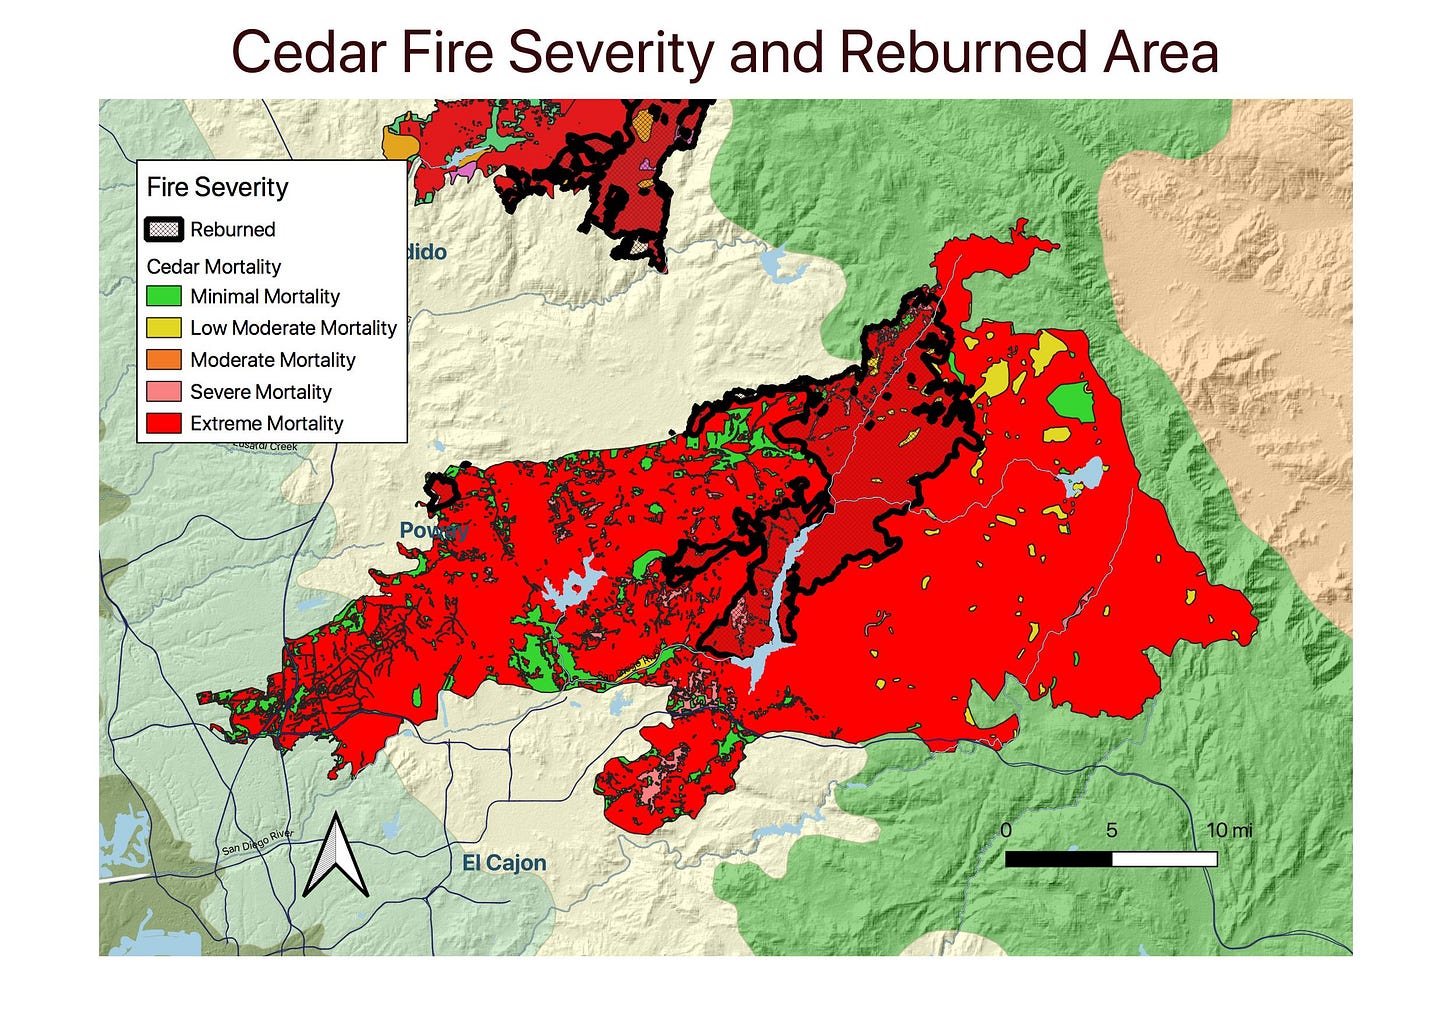
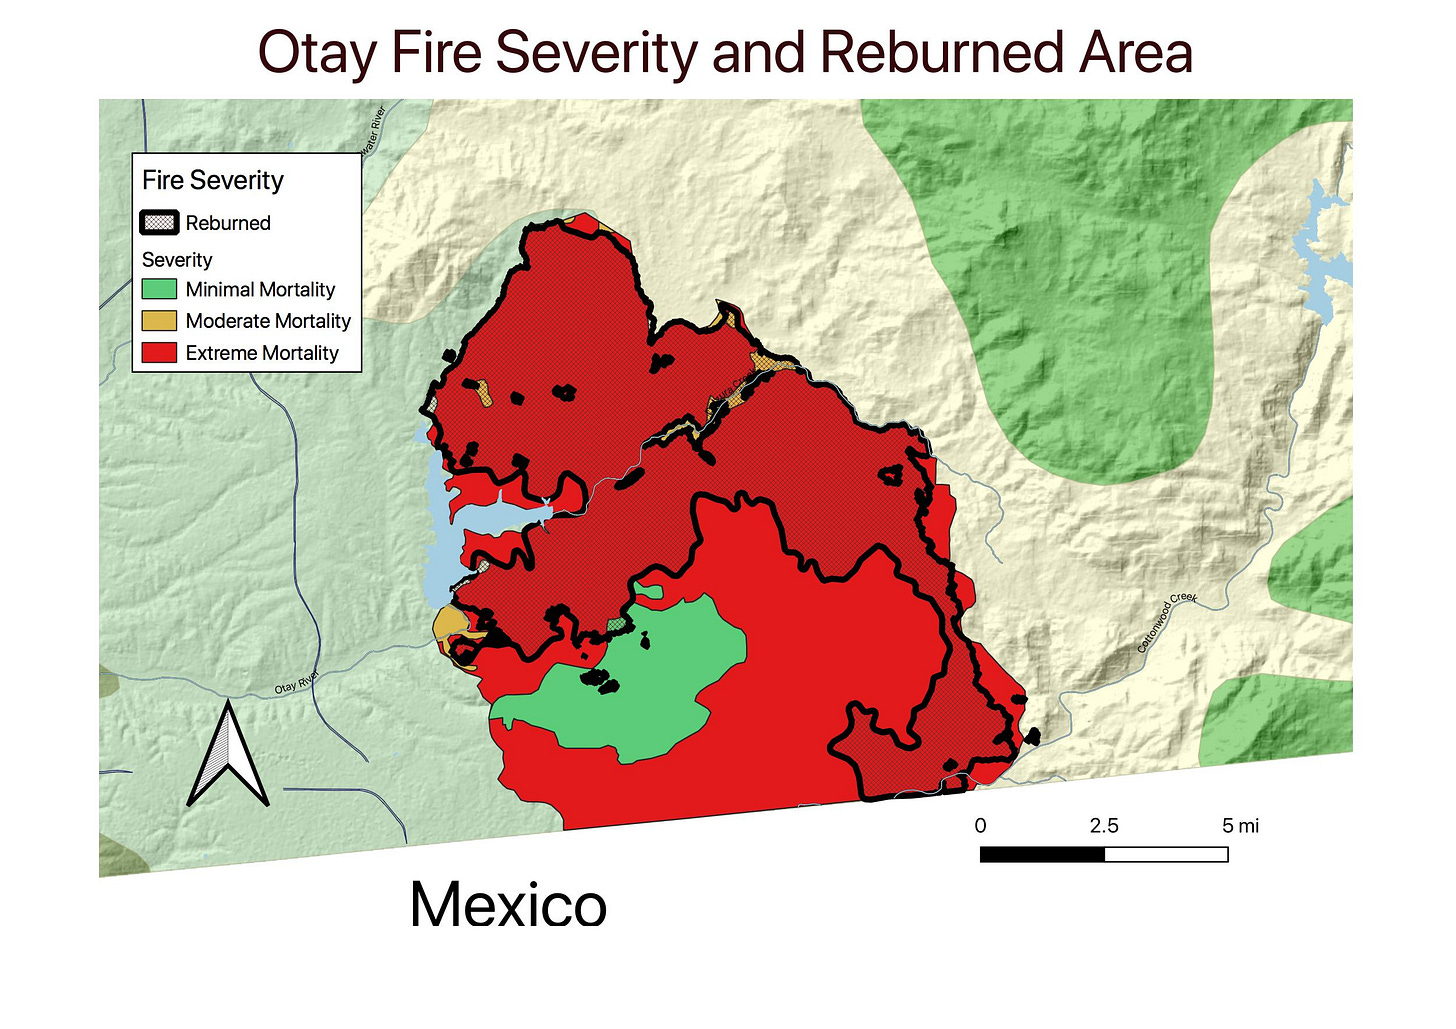
Wildfires will burn some areas more severely than others, consuming a greater percentage of vegetation in those areas, while other areas only have a moderate or very low amount burned. Once we look at the most severely burned areas of the fires, they shed a lot more light on the dynamics of reburning. Mortality of 76 percent or greater is considered extremely burned.
Fire % Extremely Burned % of Extremely Burned Reburned
Paradise 80% 84.5%
Cedar 87.7% 88.0%
Otay 88.4% 95.4%
Table 2.
In the Paradise Fire, 80 percent was extremely burned; 84 percent of the reburned area had been extremely burned. For the Cedar Fire 87.7 percent was extremely burned; of the reburned area, 88 percent had been extremely burned. For the Otay Fire 88.4 percent was extremely burned; and 95 percent of the reburned area had been extremely burned.
In other words, the most severely burned areas, the areas with the lowest fuel loads, were more likely to burn than the less severely burned areas, just the opposite of what the fuel load theory would have us assume.
In looking at the reburned areas, it is easy to see the factors that led to their reburning. The Otay fire burned on and around Otay Mountain, a mountain that rises dramatically from the surrounding foothills. Winds coming from the east would fan flames at the base, with flames quickly spreading up the mountainside.
The reburned potion of the Cedar Fire is in and around a steep sided canyon that runs from a northeast to southeast direction, almost parallel to the prevailing Santa Ana winds. It is not difficult to imagine this canyon working as a sort of natural bellows with the Santa Anas and increasing the potential to spread fire. Similar conditions led to the reburning of the Paradise Fire area.
This is not a peer reviewed study. It’s just me playing around with my GIS program, to see what I can come up with. I believe, nonetheless, that the evidence here disproves the assumption that the fuel load of chaparral needs to be controlled to quell wildfires in southern California. Perhaps we can change the minds Cal Fire, the state department of forestry and fire protection, that maintains programs of culling chaparral and controlled burns of chaparral that harm the chaparral and do not restrict wildfires.
GIS sources: SanGIS, sangis.org; San Diego State University GIS Data Center maps.sdsu.edu
For more environmental news follow me on Twitter @EcoScripsit.
Minnich, Richard A., Bahre, C.J. "Wildland Fire and Chaparral Succession Along the California-Baja California Boundary" International Journal of Wildland Fires 5, no. 1 (1995): 13-24.
"Brush returns to San Diego wildfire areas." UPI Archive: General News, 7 Mar. 2004. Gale OneFile: News, link.gale.com/apps/doc/A440274169/STND?u=sddp_main&sid=bookmark-STND&xid=4f68cd59. Accessed 3 Jan. 2022.
"Crews keep eye on areas of Ventura County vulnerable to wildfires." Ventura County Star [Ventura, CA], 12 May 2013. Gale OneFile: News, link.gale.com/apps/doc/A329591719/STND?u=sddp_main&sid=bookmark-STND&xid=5fd515df. Accessed 31 Dec. 2021.
Green, Lisle R. 1970. “An experimental prescribed burn to reduce fuel hazard in chaparral.” Res. Note PSW-216. Berkeley, CA: U.S. Department of Agriculture Forest Service, Pacific Southwest Forest and Range Experiment Station. 6 p
Miller, Philip C., Poole, Dennis K. "Patterns of Water Use by Shrubs in Southern California." Forrest Science 25, no. 1 (1979): 84-98.
Halsey, Richard A. ‘Fire, Chaparral, and Survival in Southern California” Sunbelt Publications 2008 pp 48,49.
Keeley, Jon E., Fotheringham, C.J., Morais, Marko “Reexamining Fire Suppression Impacts on Brushland Fire Regimes” Science 284, June 11 (1999): 1829-1832


Folks, sorry about the formatting problems with the tables. One the webpage they look OK, but in emails they lose their formatting. I tried importing tables, but that didn't work either. Maybe Substack will fix this problem soon.